About the Project
This map is the result of a research project that aims to ground AI. Literally: It puts the entire scientific literature on algorithms, machine learning, and artificial intelligence on the floor for you to walk on and explore.
We talk a lot about AI, especially the spectacular, sensationalist and revolutionizing aspects of AI, but maybe we tend to forget the mundane ways in which it is already everywhere around us. From speech recognition to flight control or cybersecurity, from analyses of everything from tea quality and swim technique to hormone secretion and mammograms for diagnosing breast cancer, AI and machine learning algorithms already feature as a solution to a range of existing problems.
Sometimes, these applications cause harm or pose risks in ways that raise public concern. More often than not, they never become part of public discourse. Should they? We invite you to explore the multifaceted landscape of artificial intelligence and its associated algorithms, technologies and applications to help us figure out the answer.
How do you read the map?
Two million scientific papers about artificial intelligence
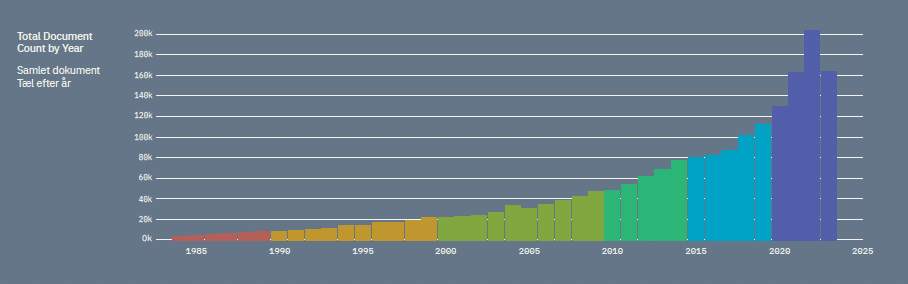
Each dot on the map represents a scientific paper. There are 2,015,031 papers in total and they are all about artificial intelligence, algorithms, or machine learning in one way or another. Most of them have been published recently. The scientific literature on AI has been growing year by year as scientists have turned their attention to new technologies, new areas of application, and all the questions they raise. The colours of the dots show the age of the papers.
Algorithms are doing four thousand different things
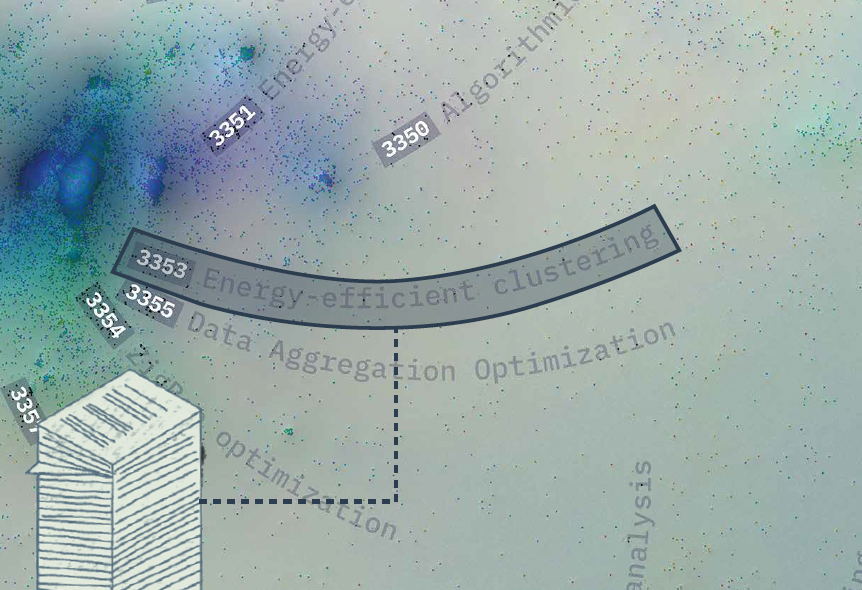
When papers are close to each other it means they are similar. They ask the same questions, use the same methods, or come to the same conclusions. We have found 4,062 groups where the papers are so similar that we can describe the specific role algorithms play in them. The headings you see on the map cover about half of these descriptions. You can read more on the digital version of the map when you use the code next to a heading.
Wider subject areas
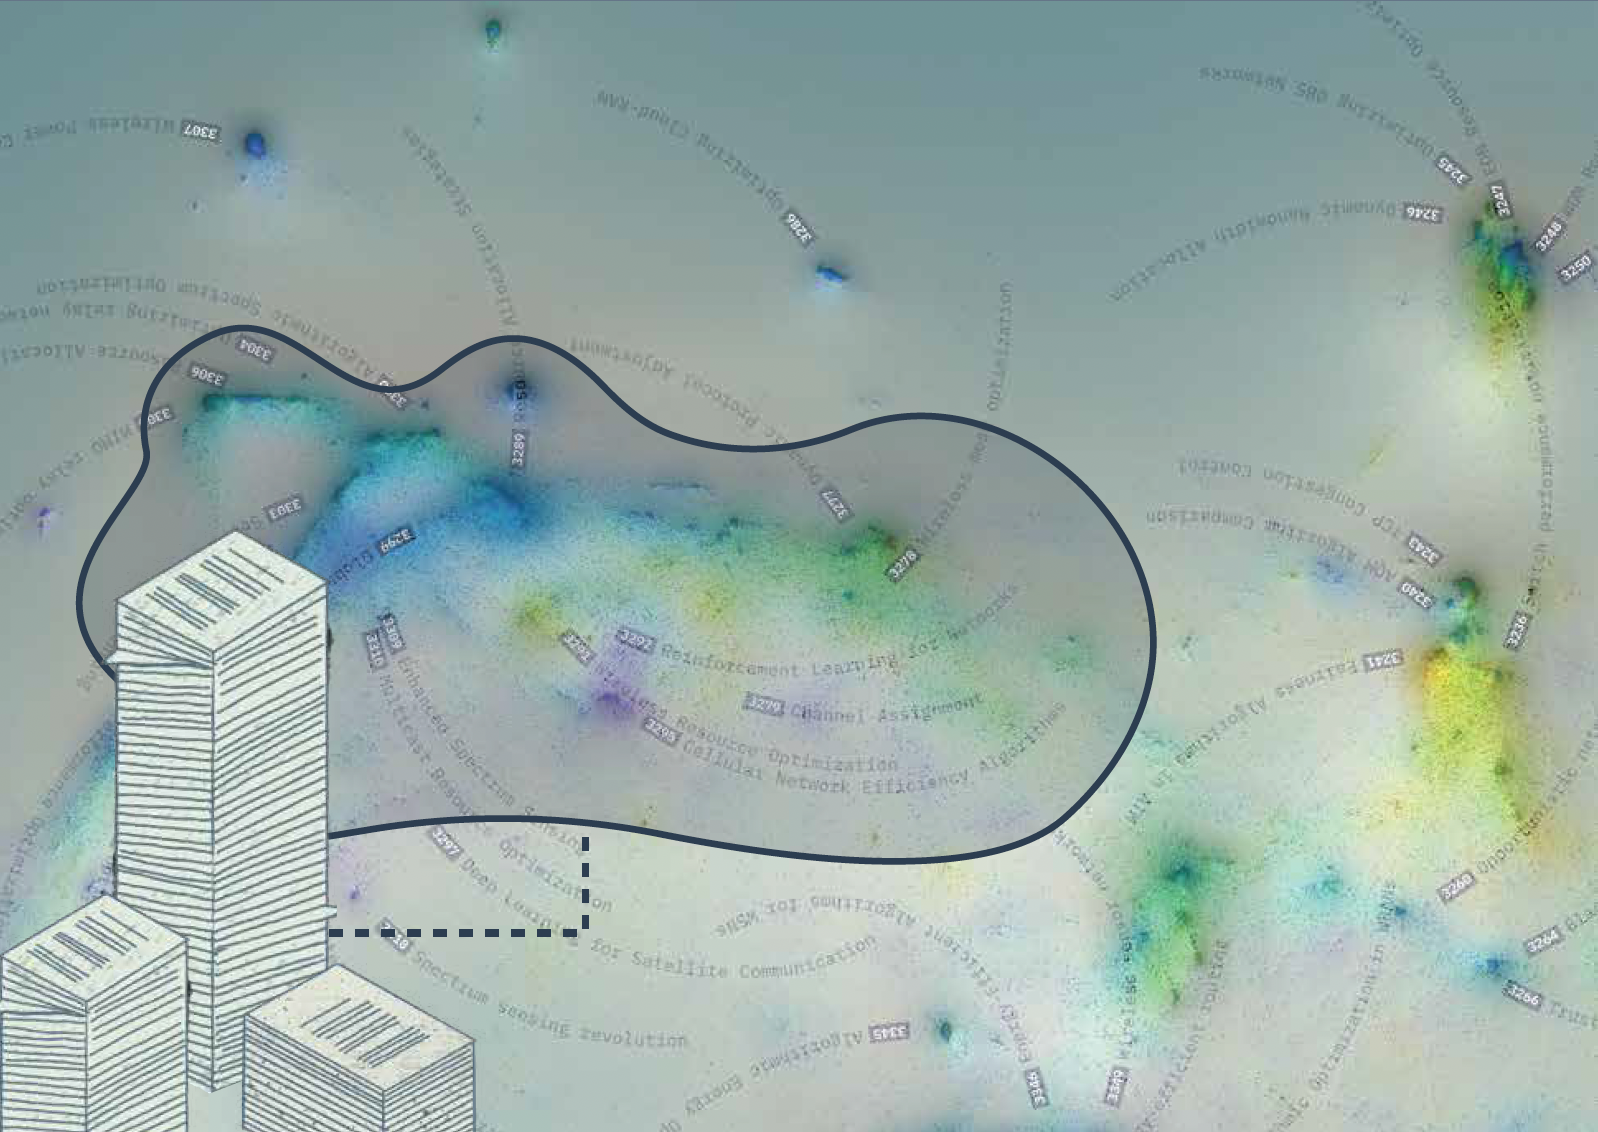
In some areas of the map the papers are clustered very close to each other. This is a sign that there is an overarching theme or a technology that they all address in different ways. These wider subject areas have no clear borders and tend to flow into each other, but you can notice how the subjects change character as you move across the map.
Sponsors